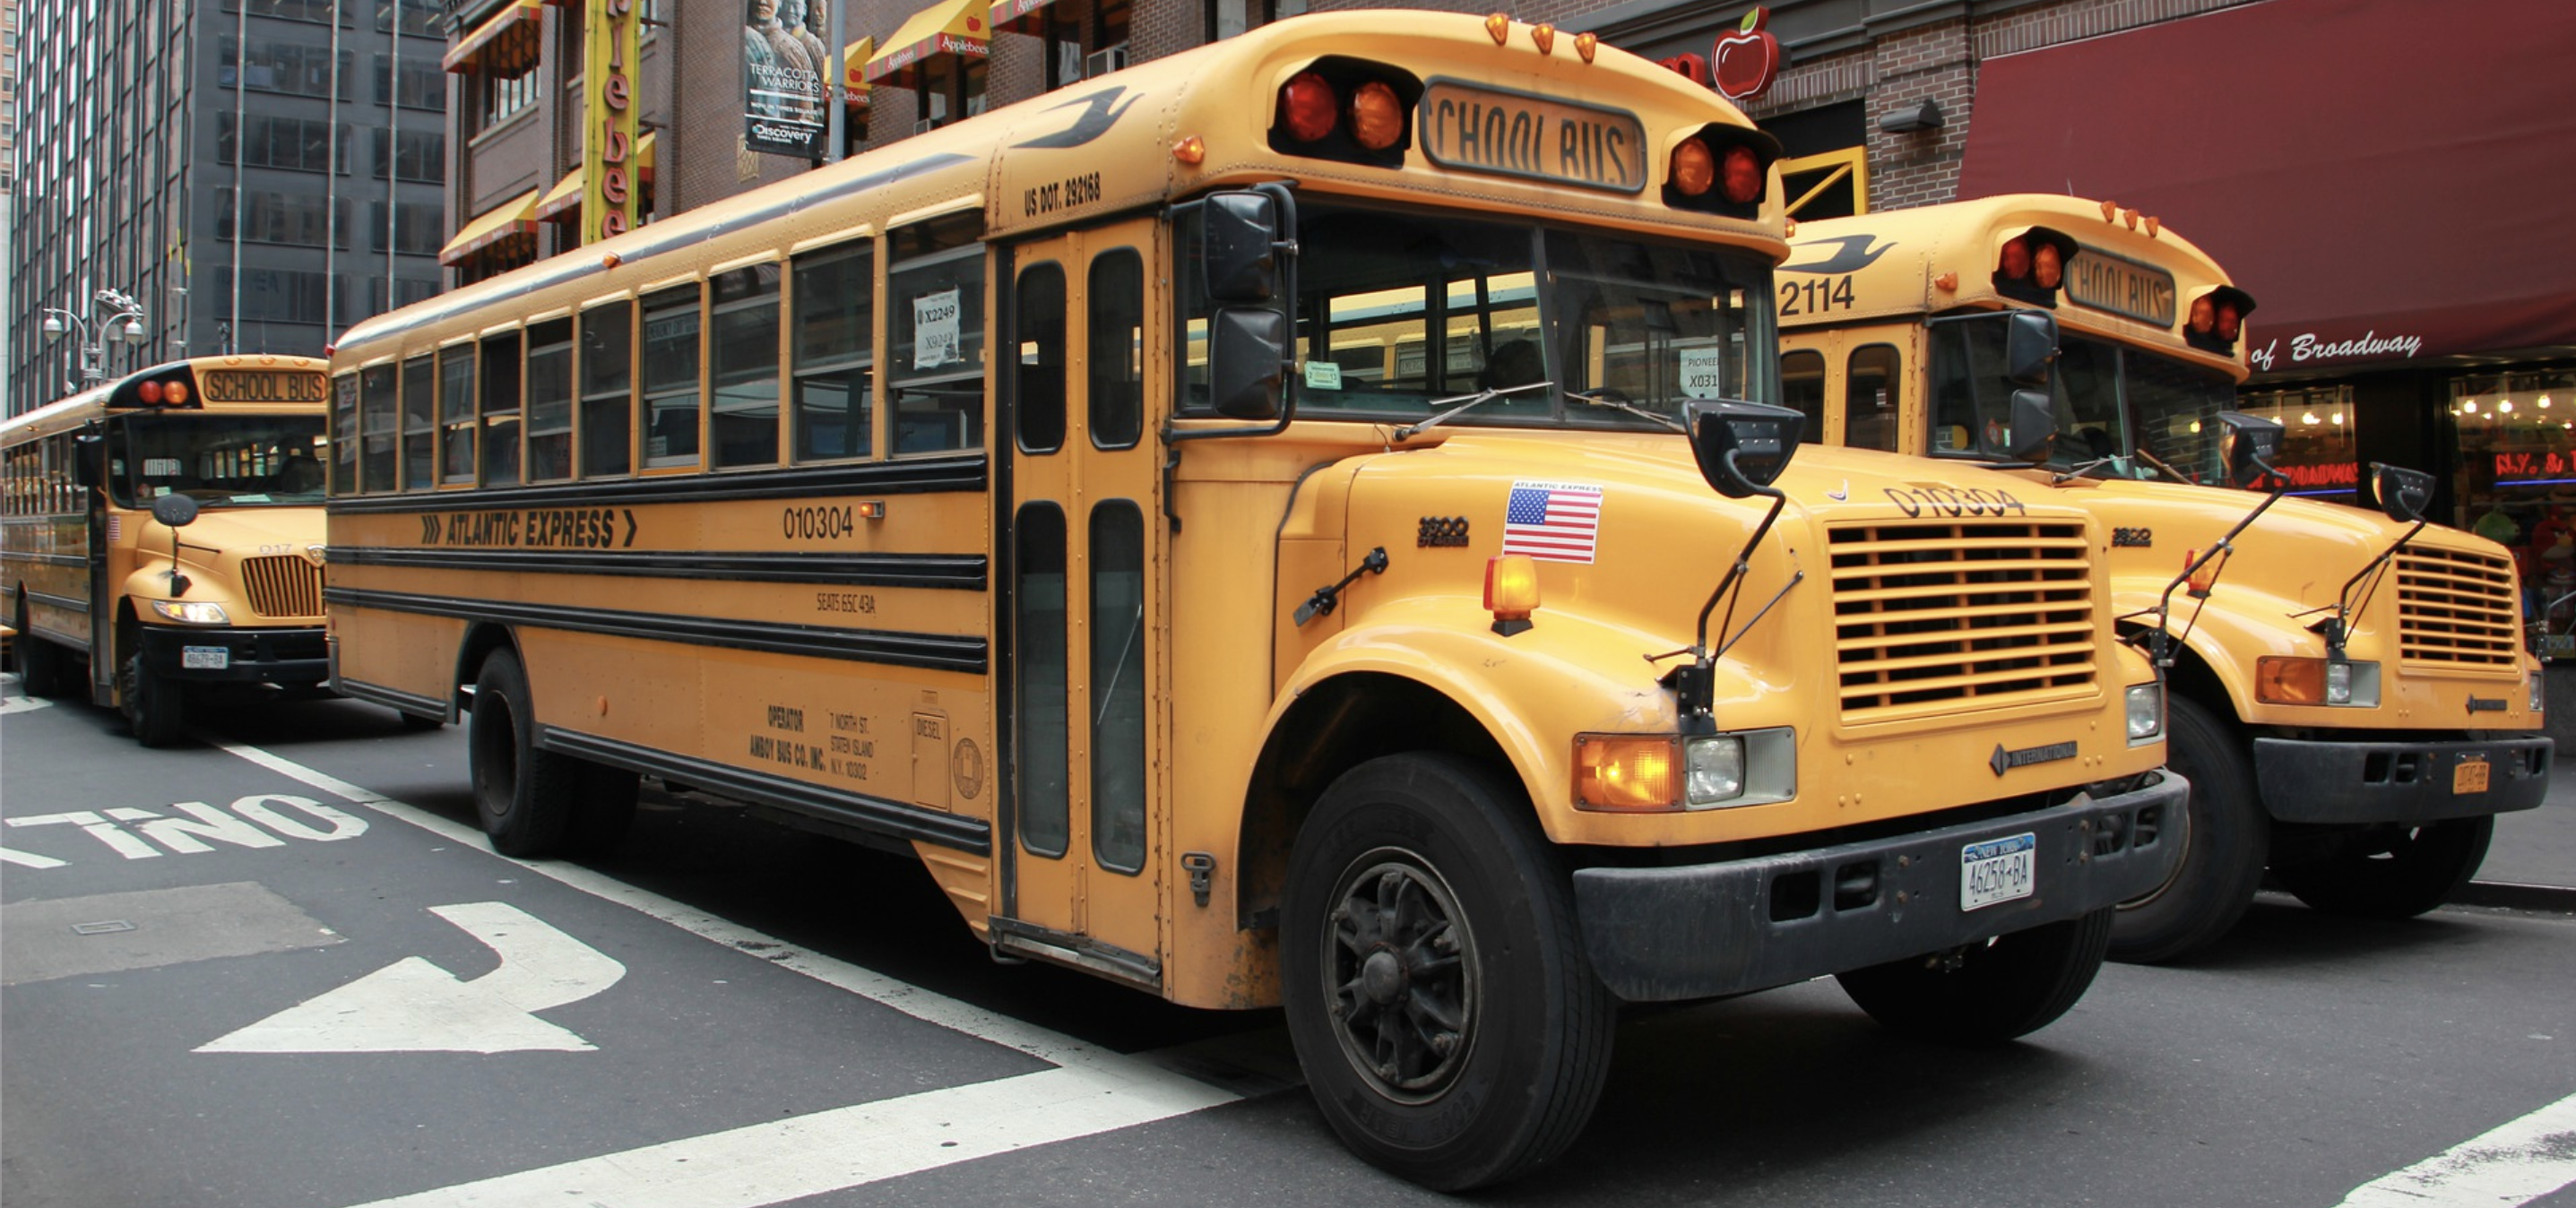
School bus in NYC. (Credit: Pixabay/Maria_Tsolakidou )
School bus in NYC. (Credit: Pixabay/Maria_Tsolakidou )
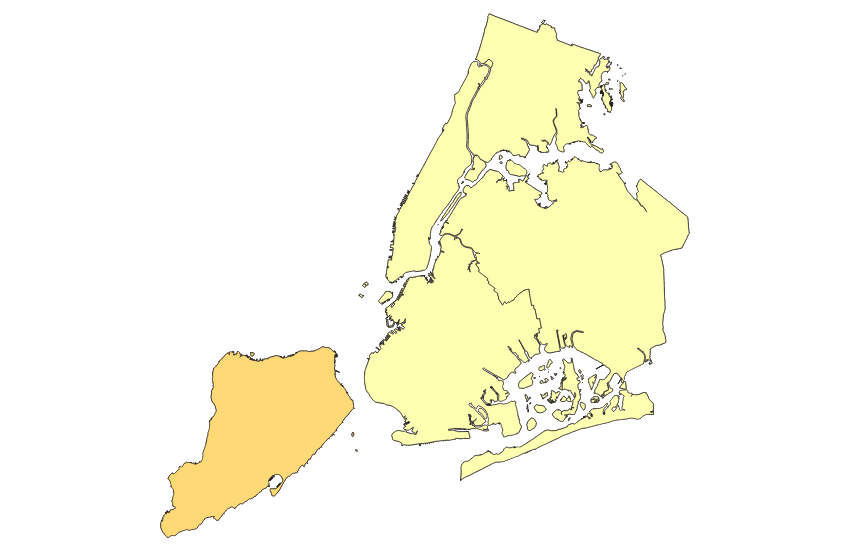
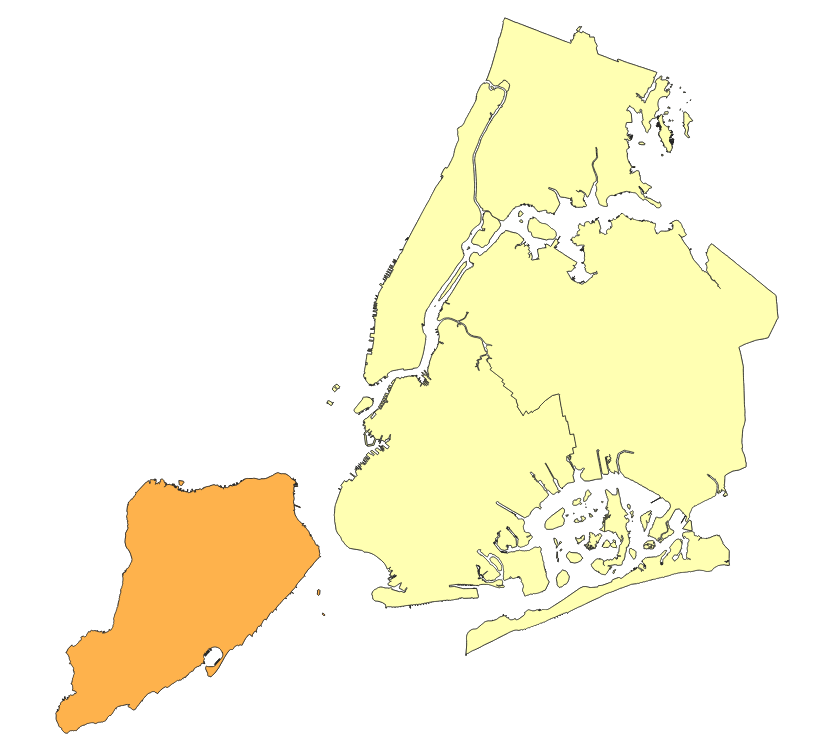
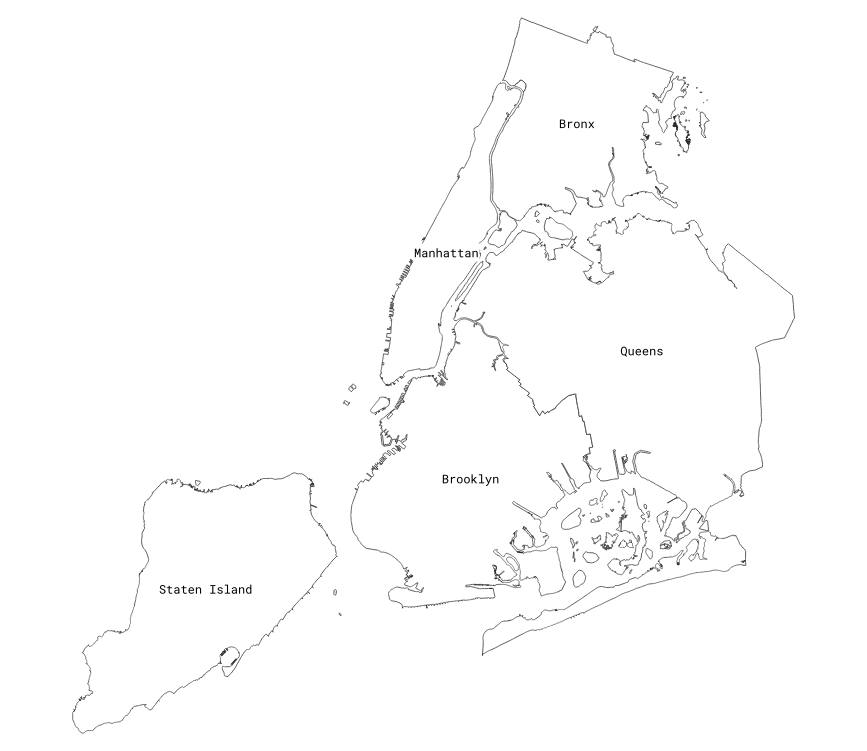
Several New York City disability advocacy groups filed a lawsuit against the District 75 school system in January. Advocates say that the system, which serves disabled students from Staten Island, is not providing students with an inclusive quality education. While this lawsuit is focused on Staten Island, does this supposed disparity exist in the other New York City boroughs?
Whenever a school bus is delayed on a route, the bus driver must fill out a form on a Department of Education (DOE) custom application reporting the delay. These reports are then released daily by the DOE Office of Public Transportation. Delays are based on bus routes, arrival and departure times, and whether the delay is due to traffic or a mechanical issue.
Since the data became public in 2015, each school year has experienced more delays than the year before it, up until the pandemic halted school bus travel in early 2020. In many cases, special education student bus routes experienced more delays that lasted longer than the general education student bus routes.
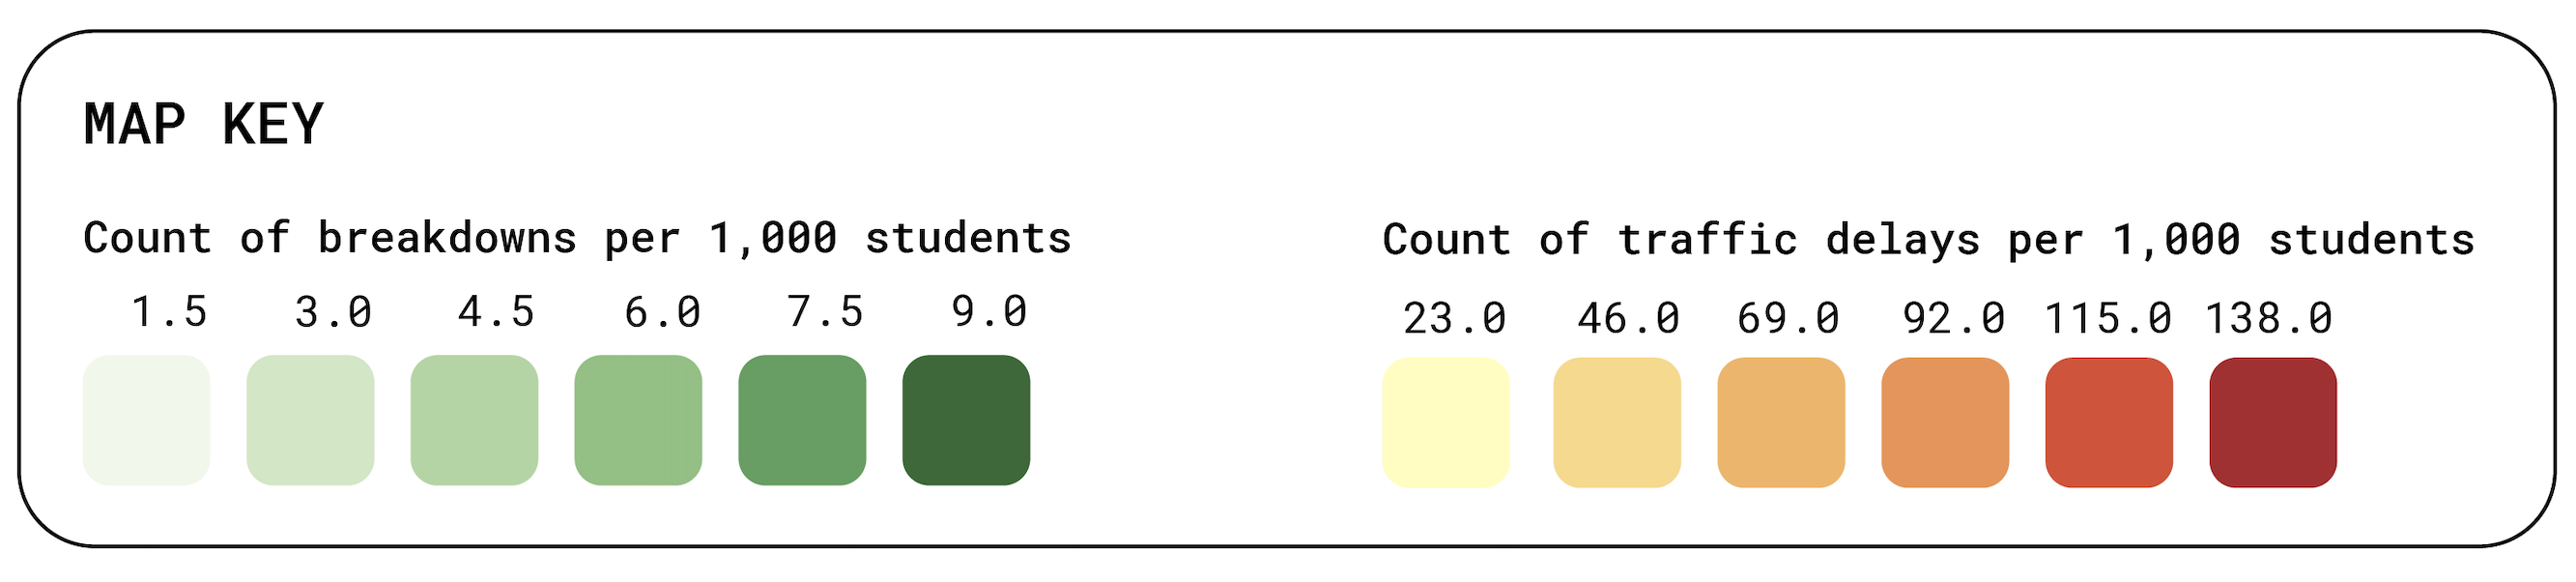
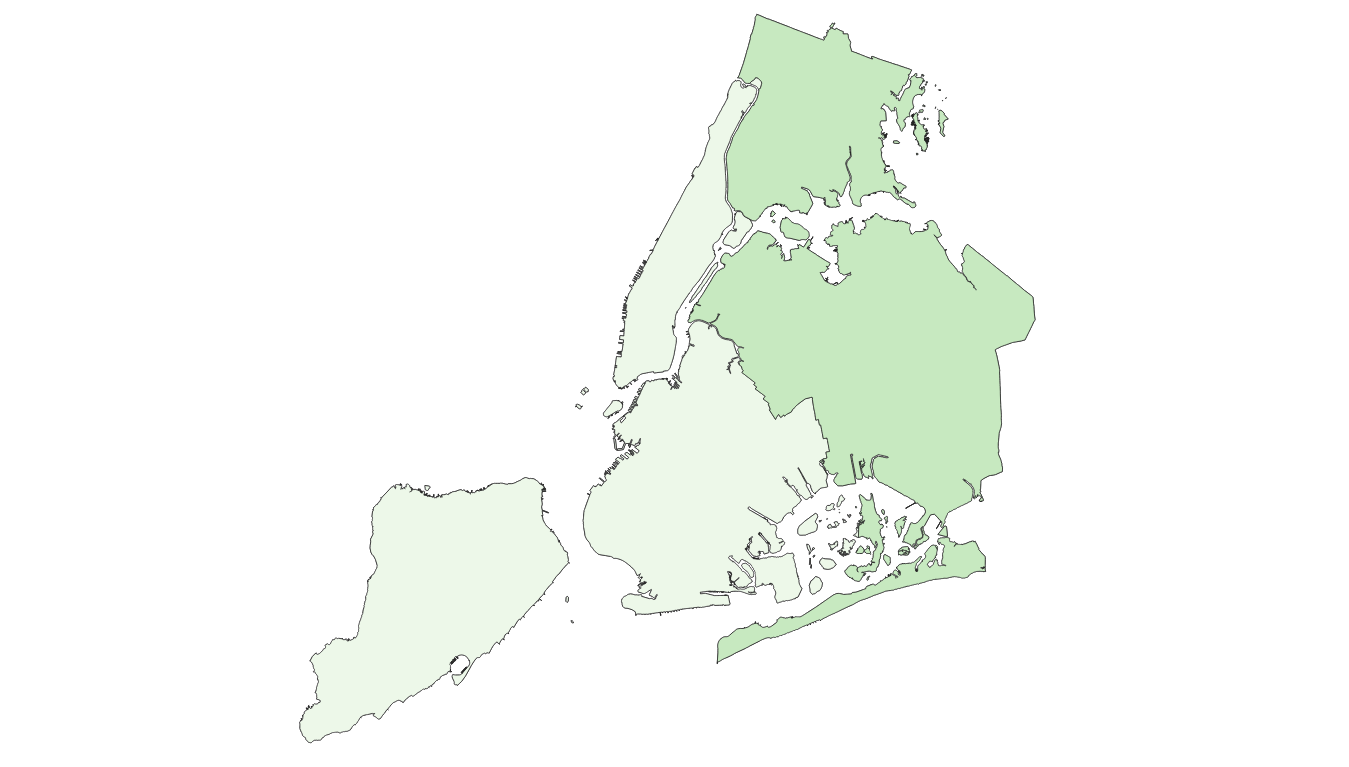
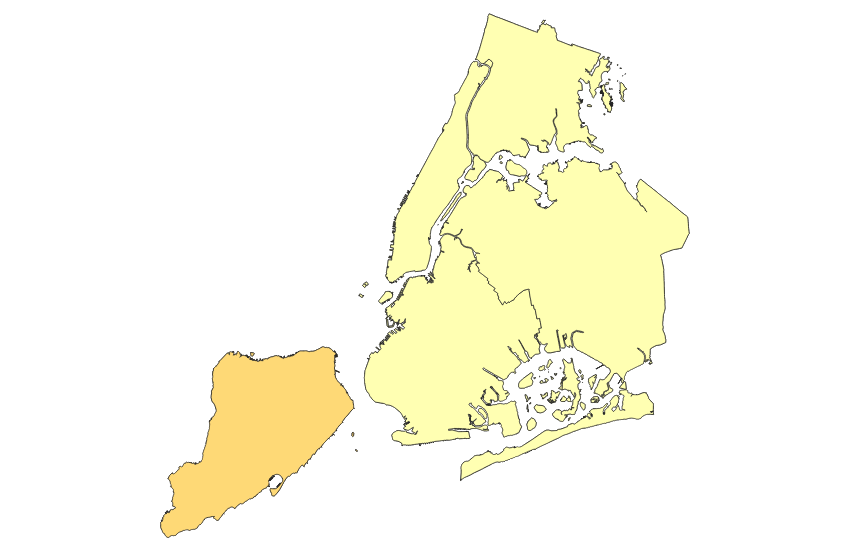
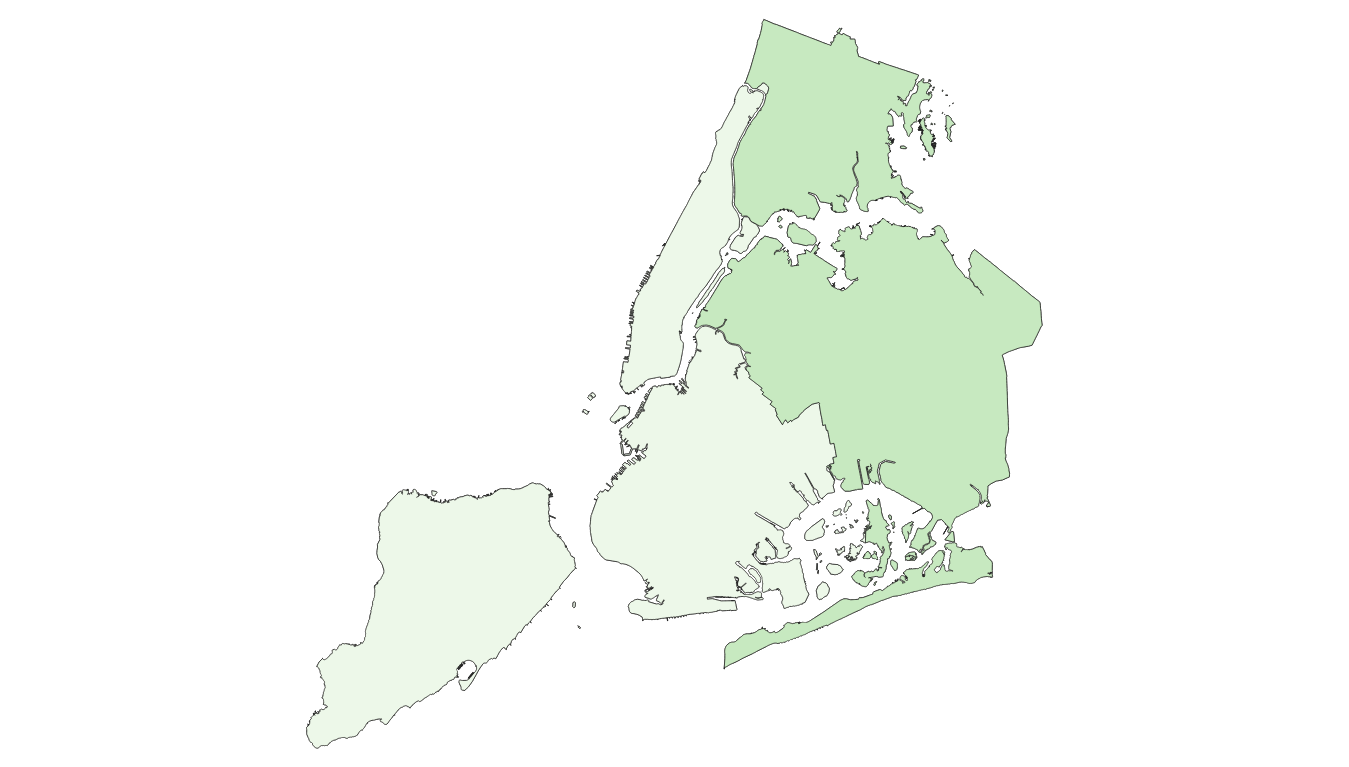
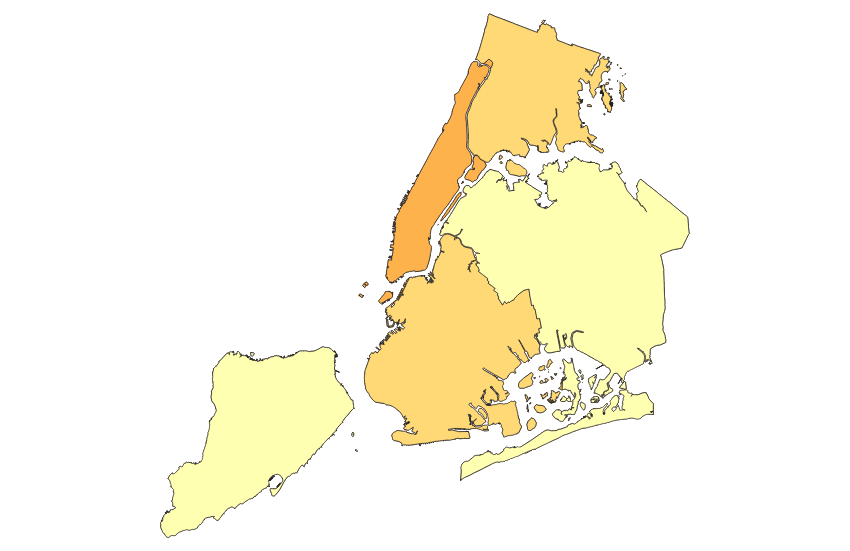
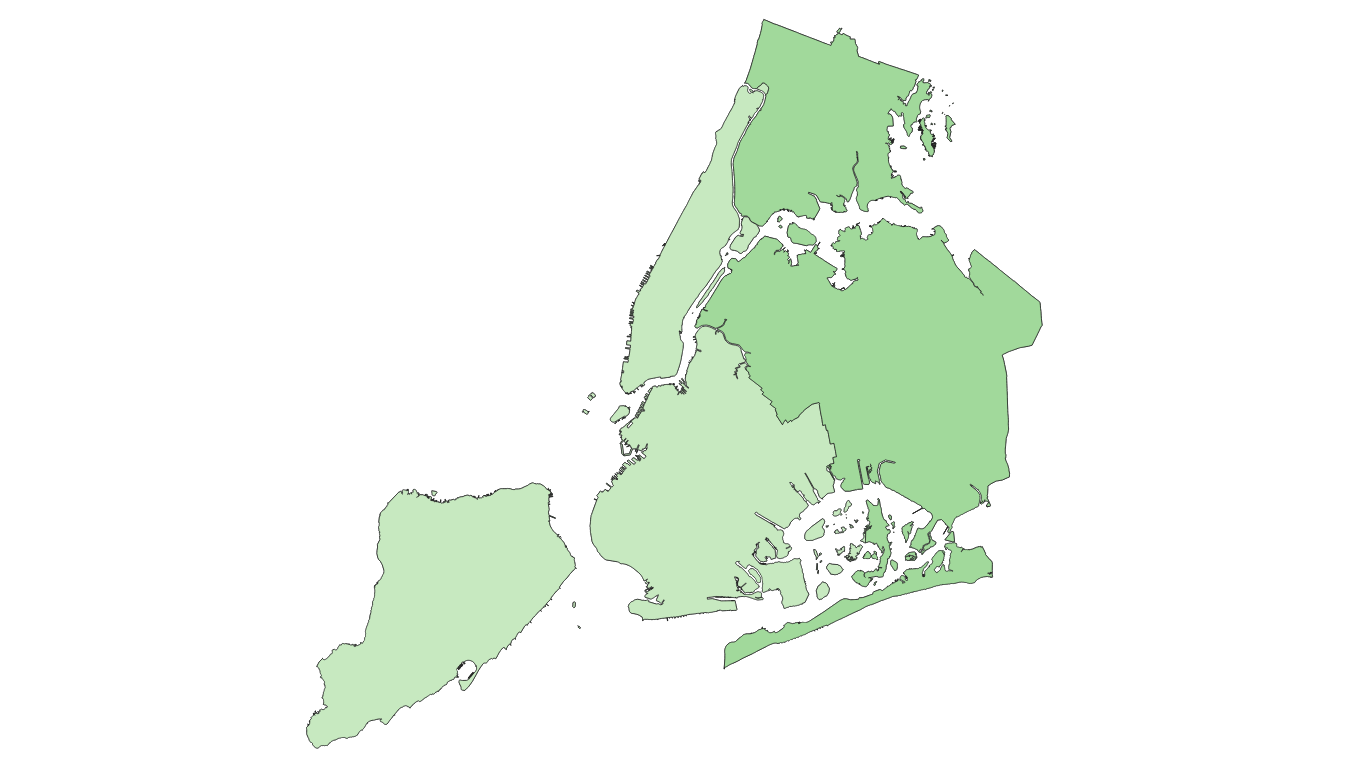
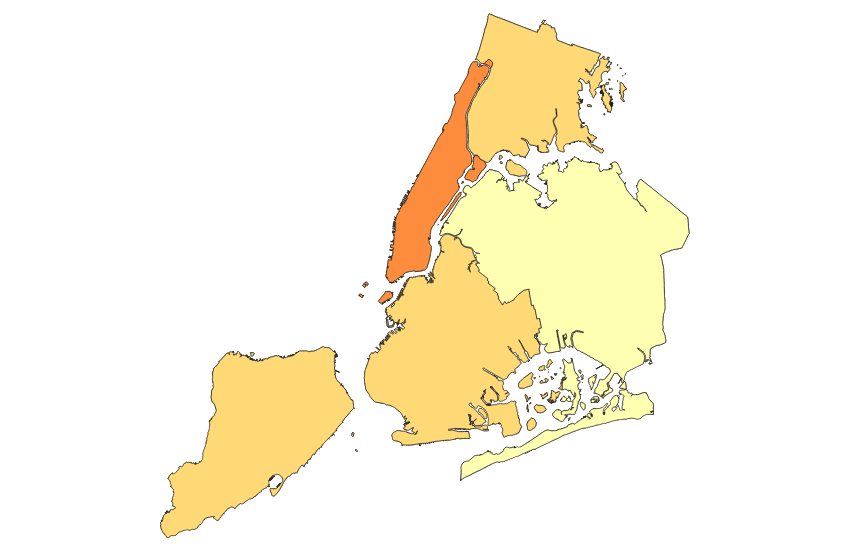
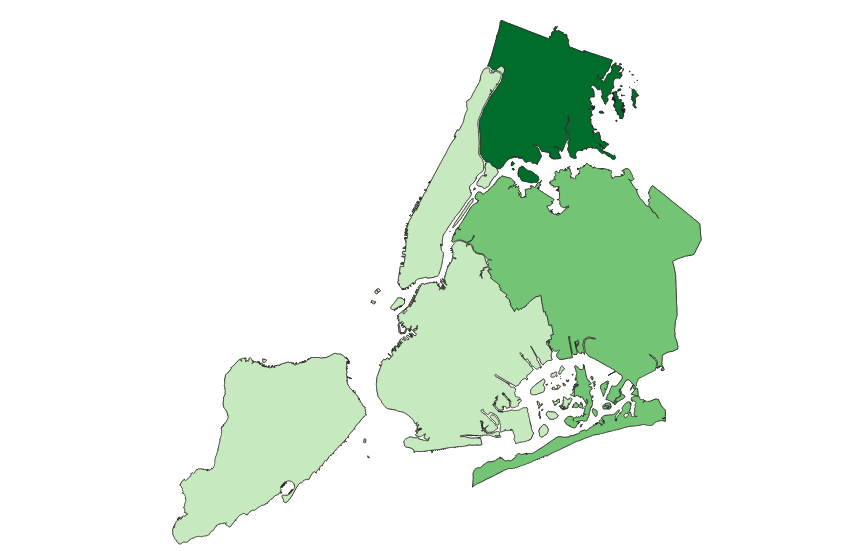
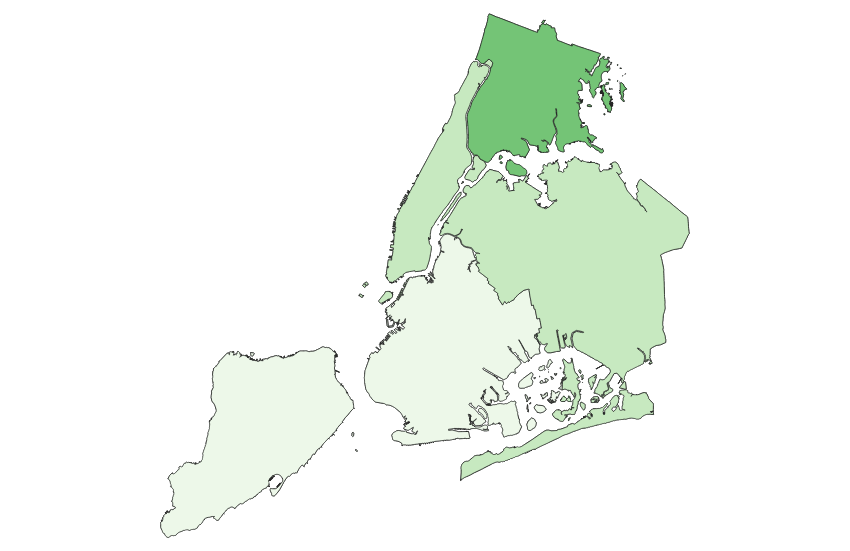
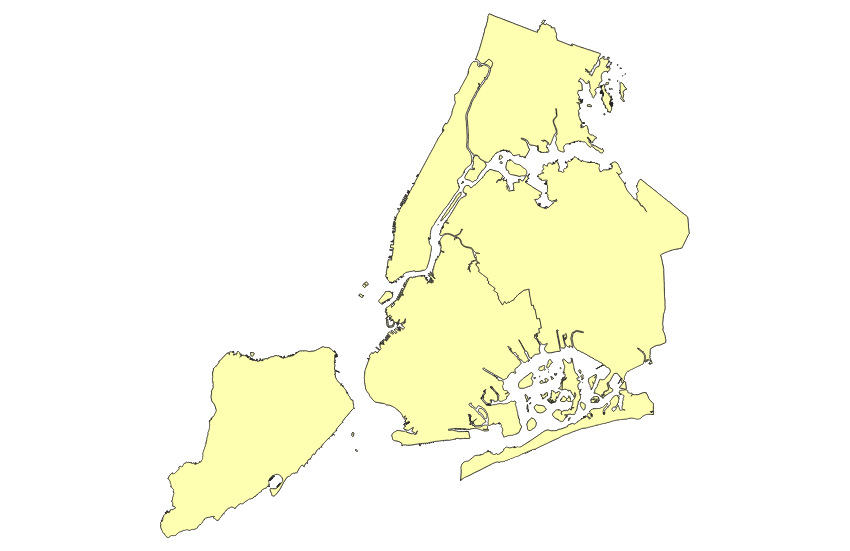
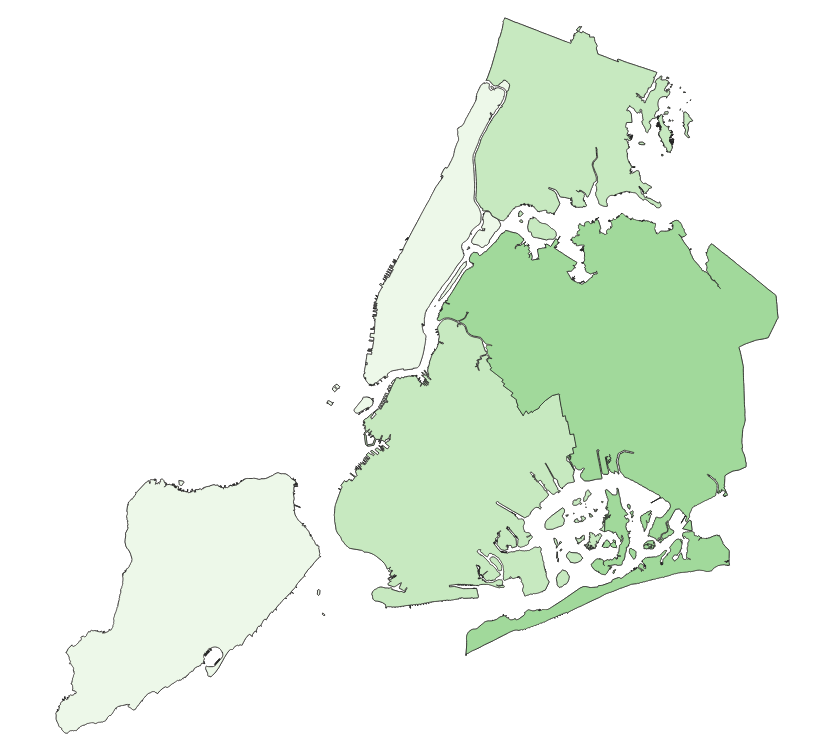
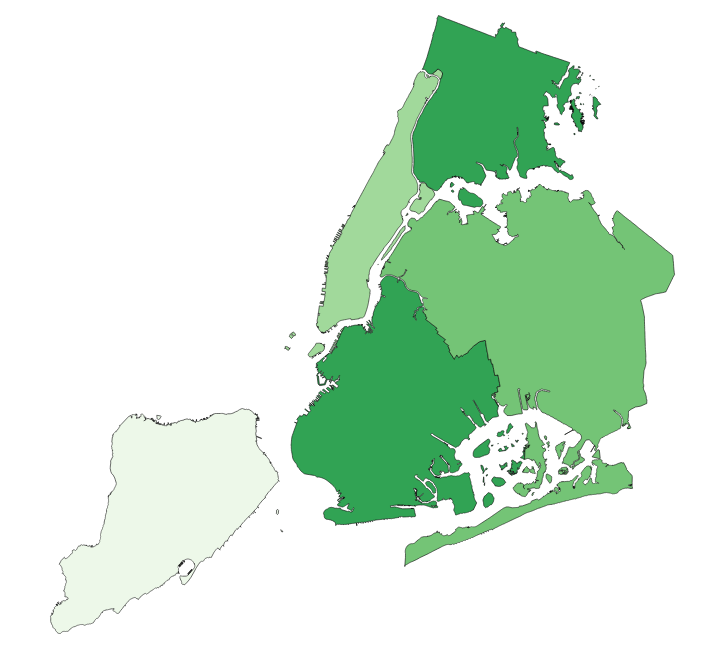
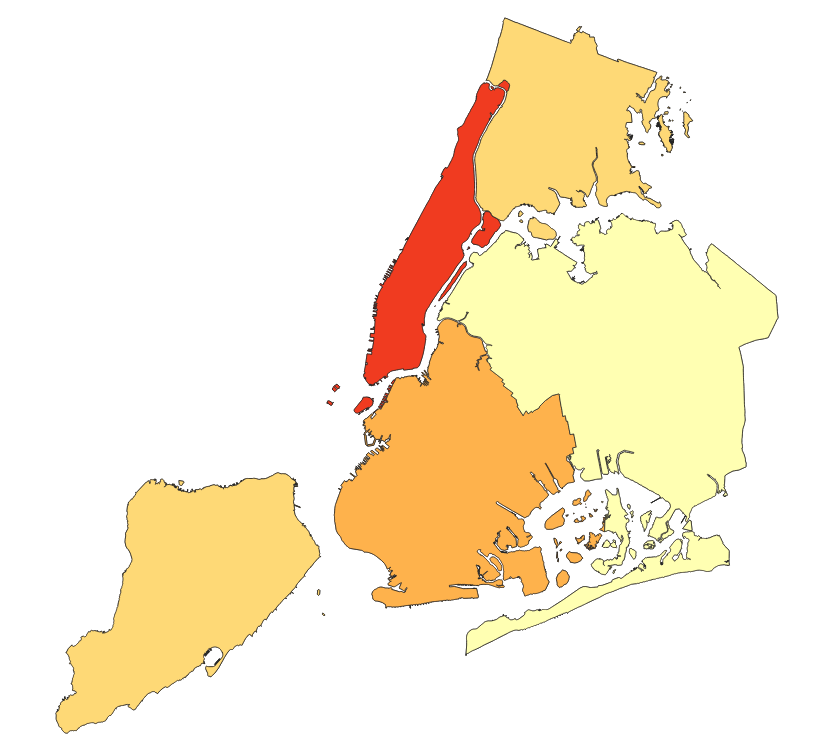
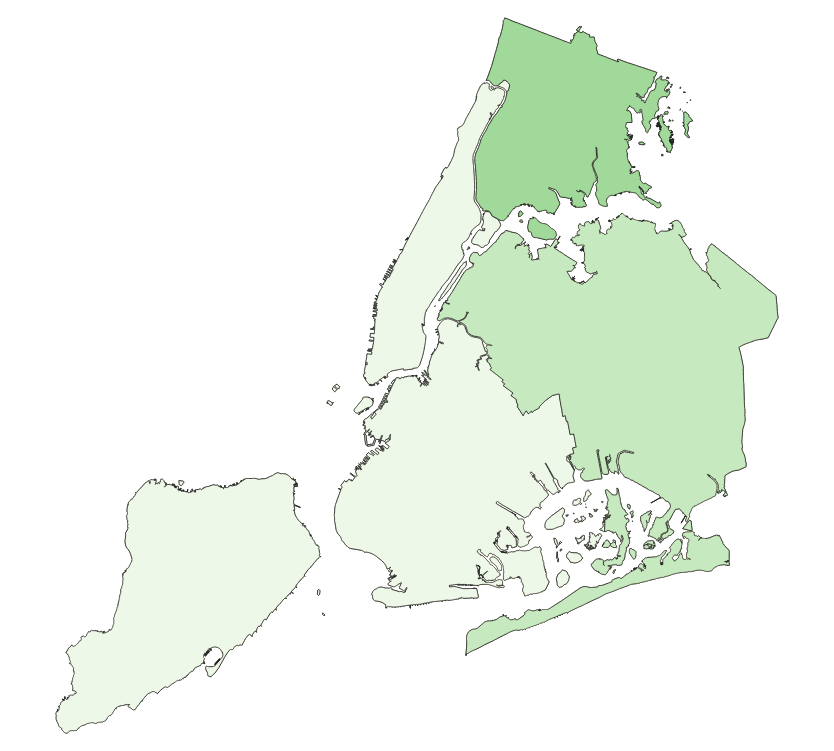
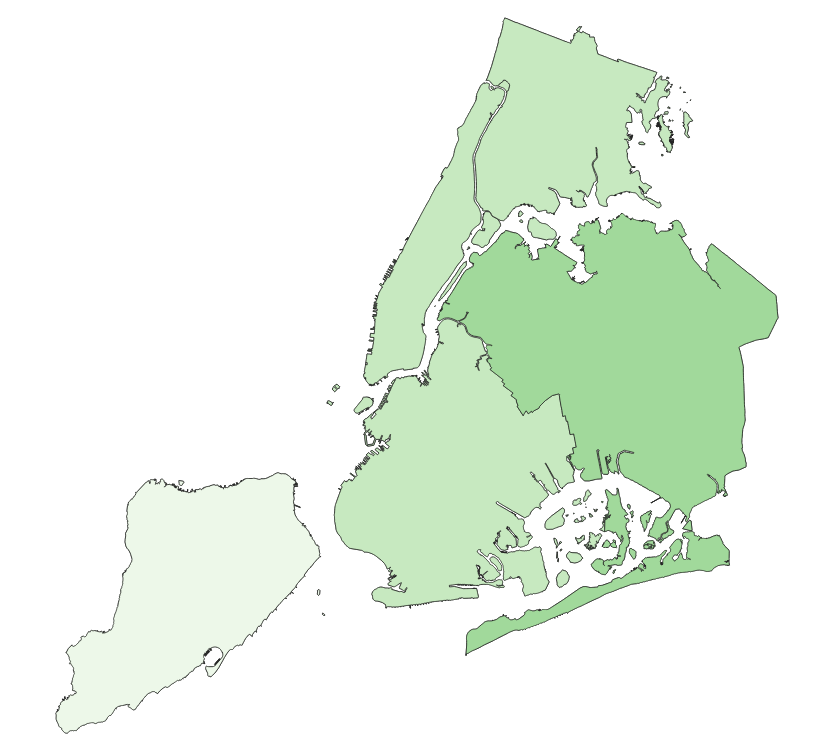
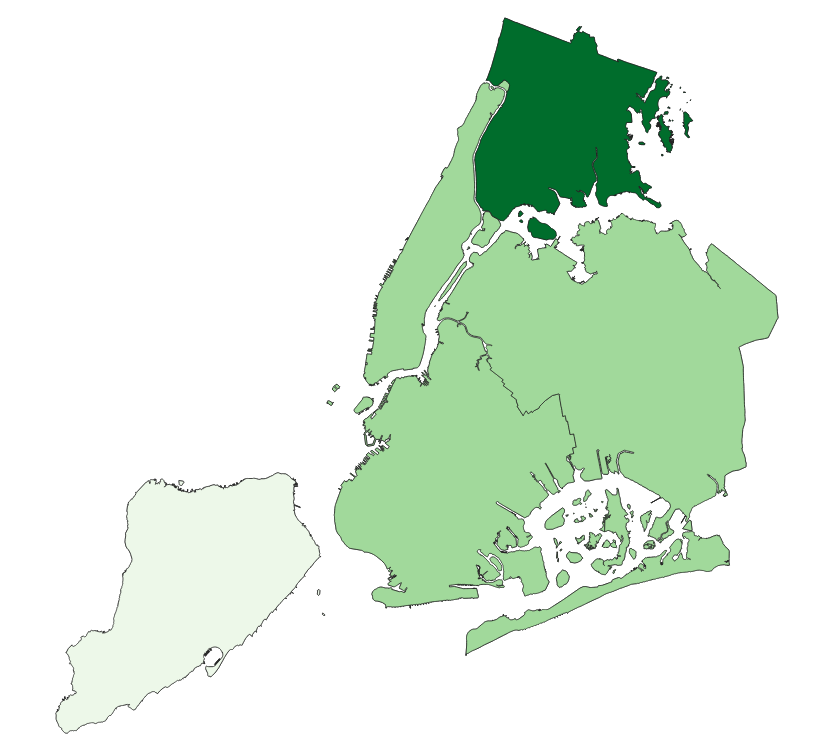
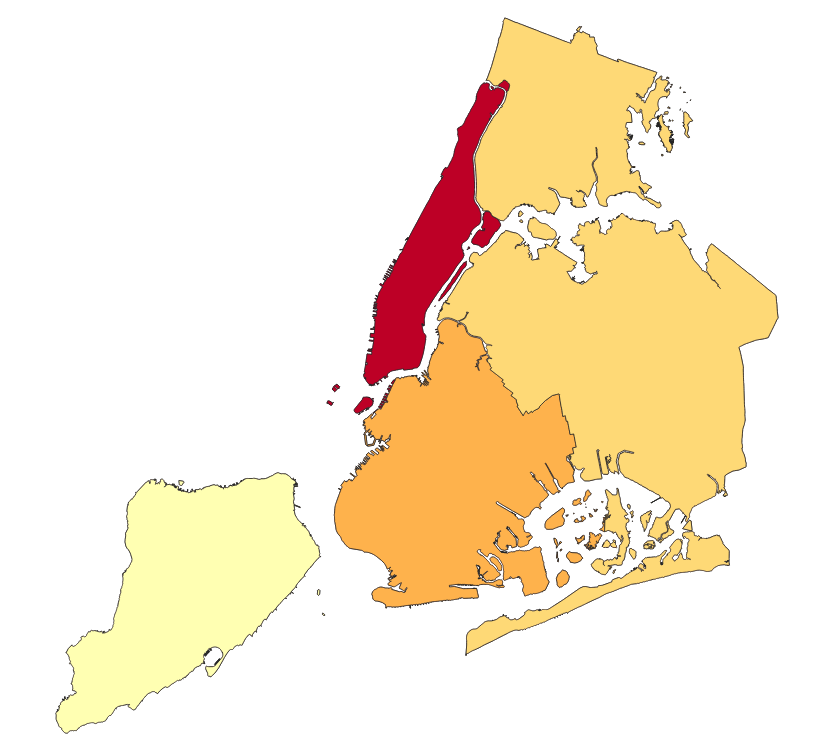
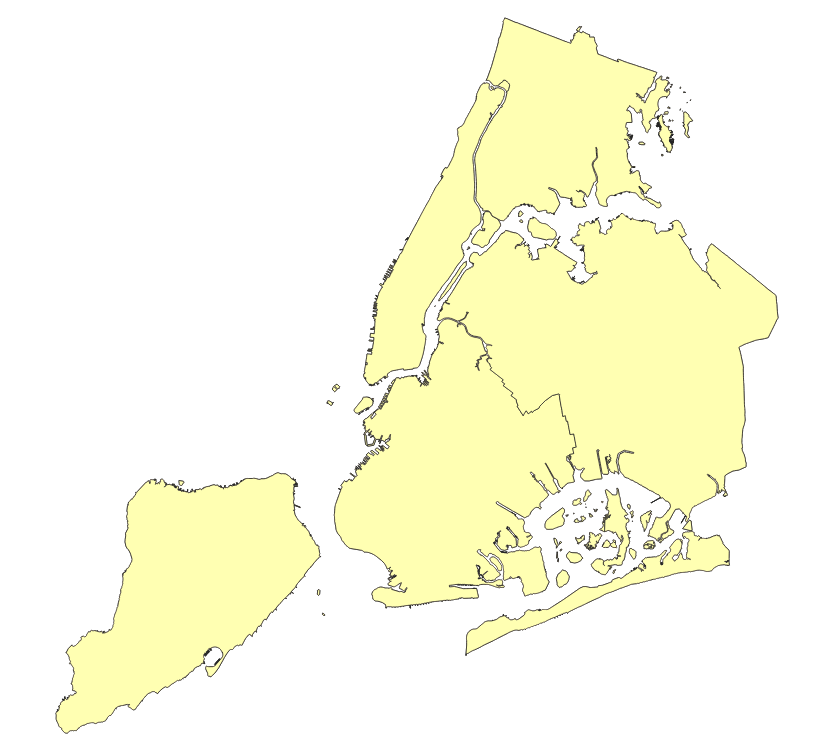
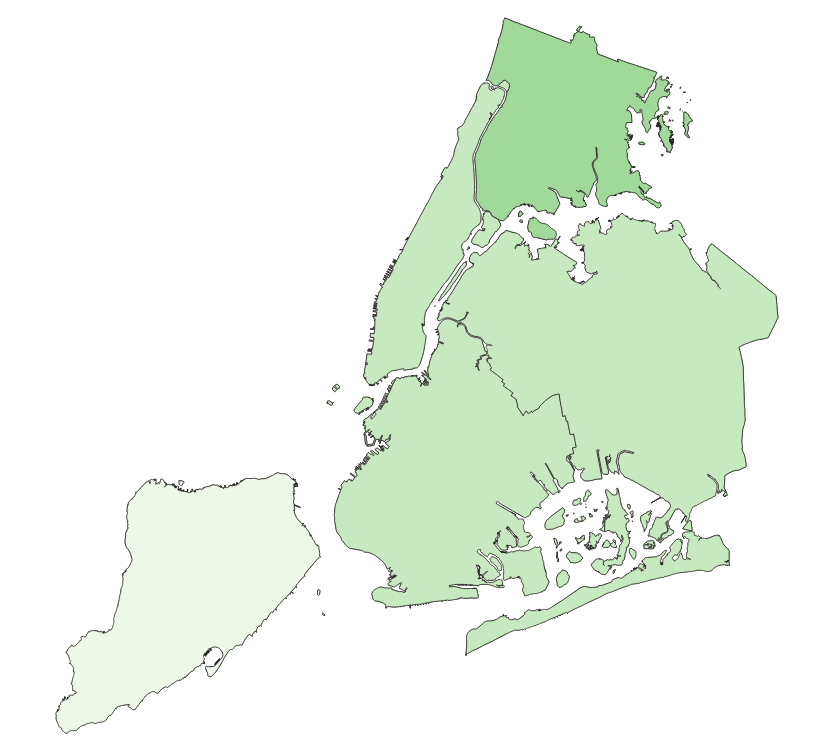
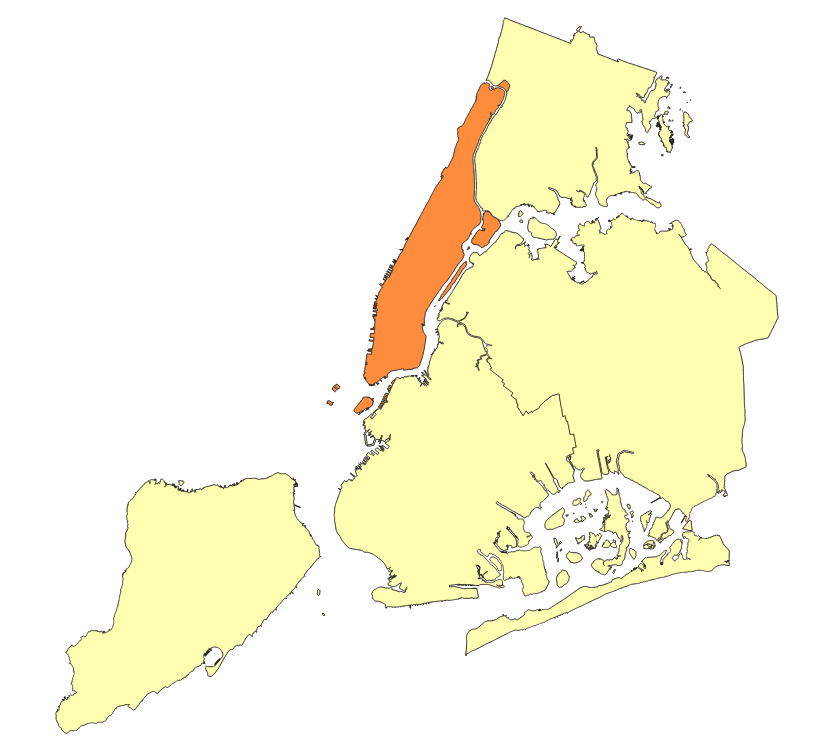
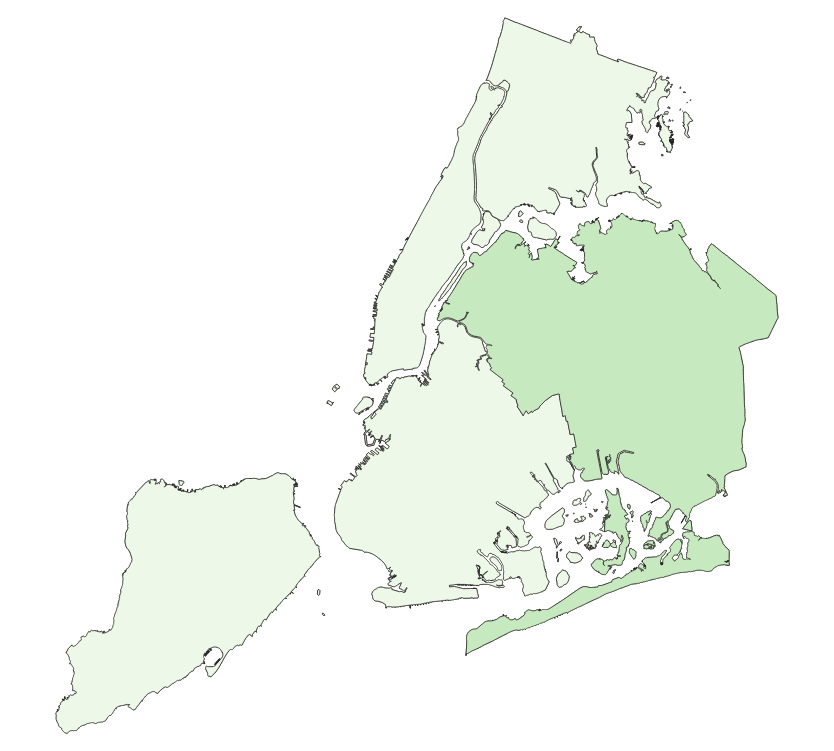
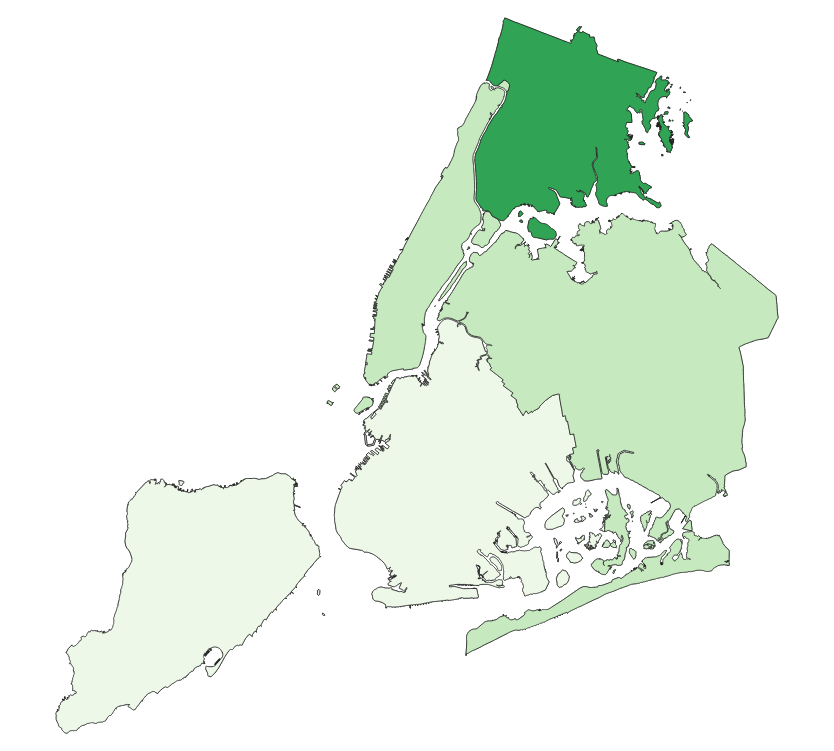
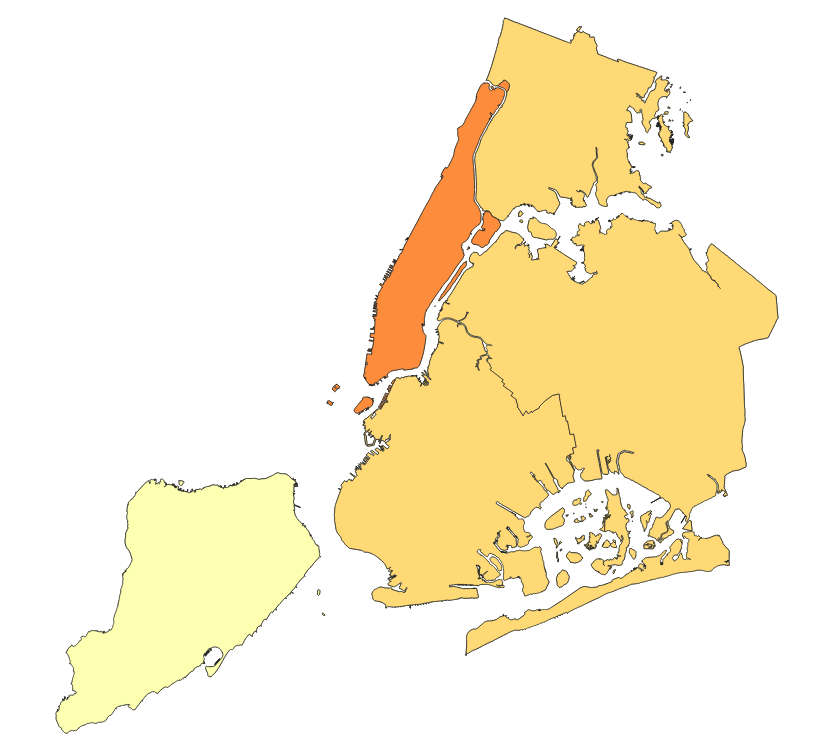
So, how does this affect your child’s commute to and from school? Below is a map of New York City. Fill out the four options describing your child’s commute: Type of Student, Time of Travel, Type of Delay, and the School Year. You will then see a map showing the average rate of delays for the school year.
Select what type of student your child is and when they are travelling to find out the average delay of their trip.


NOTES
2018 was the worst year on record for all students, with the widest disparity between special education and general education on record. Special education students were late to school over 400% more often than general education students due to traffic compared to their general education cohort.
The amount of time a student was late also varied. Below are two charts showing delay times for students in the morning and the afternoon for the 2018-2019 school year. They are broken up into 15-minute intervals. Select the dots on the chart to see the number of late students for each time period.
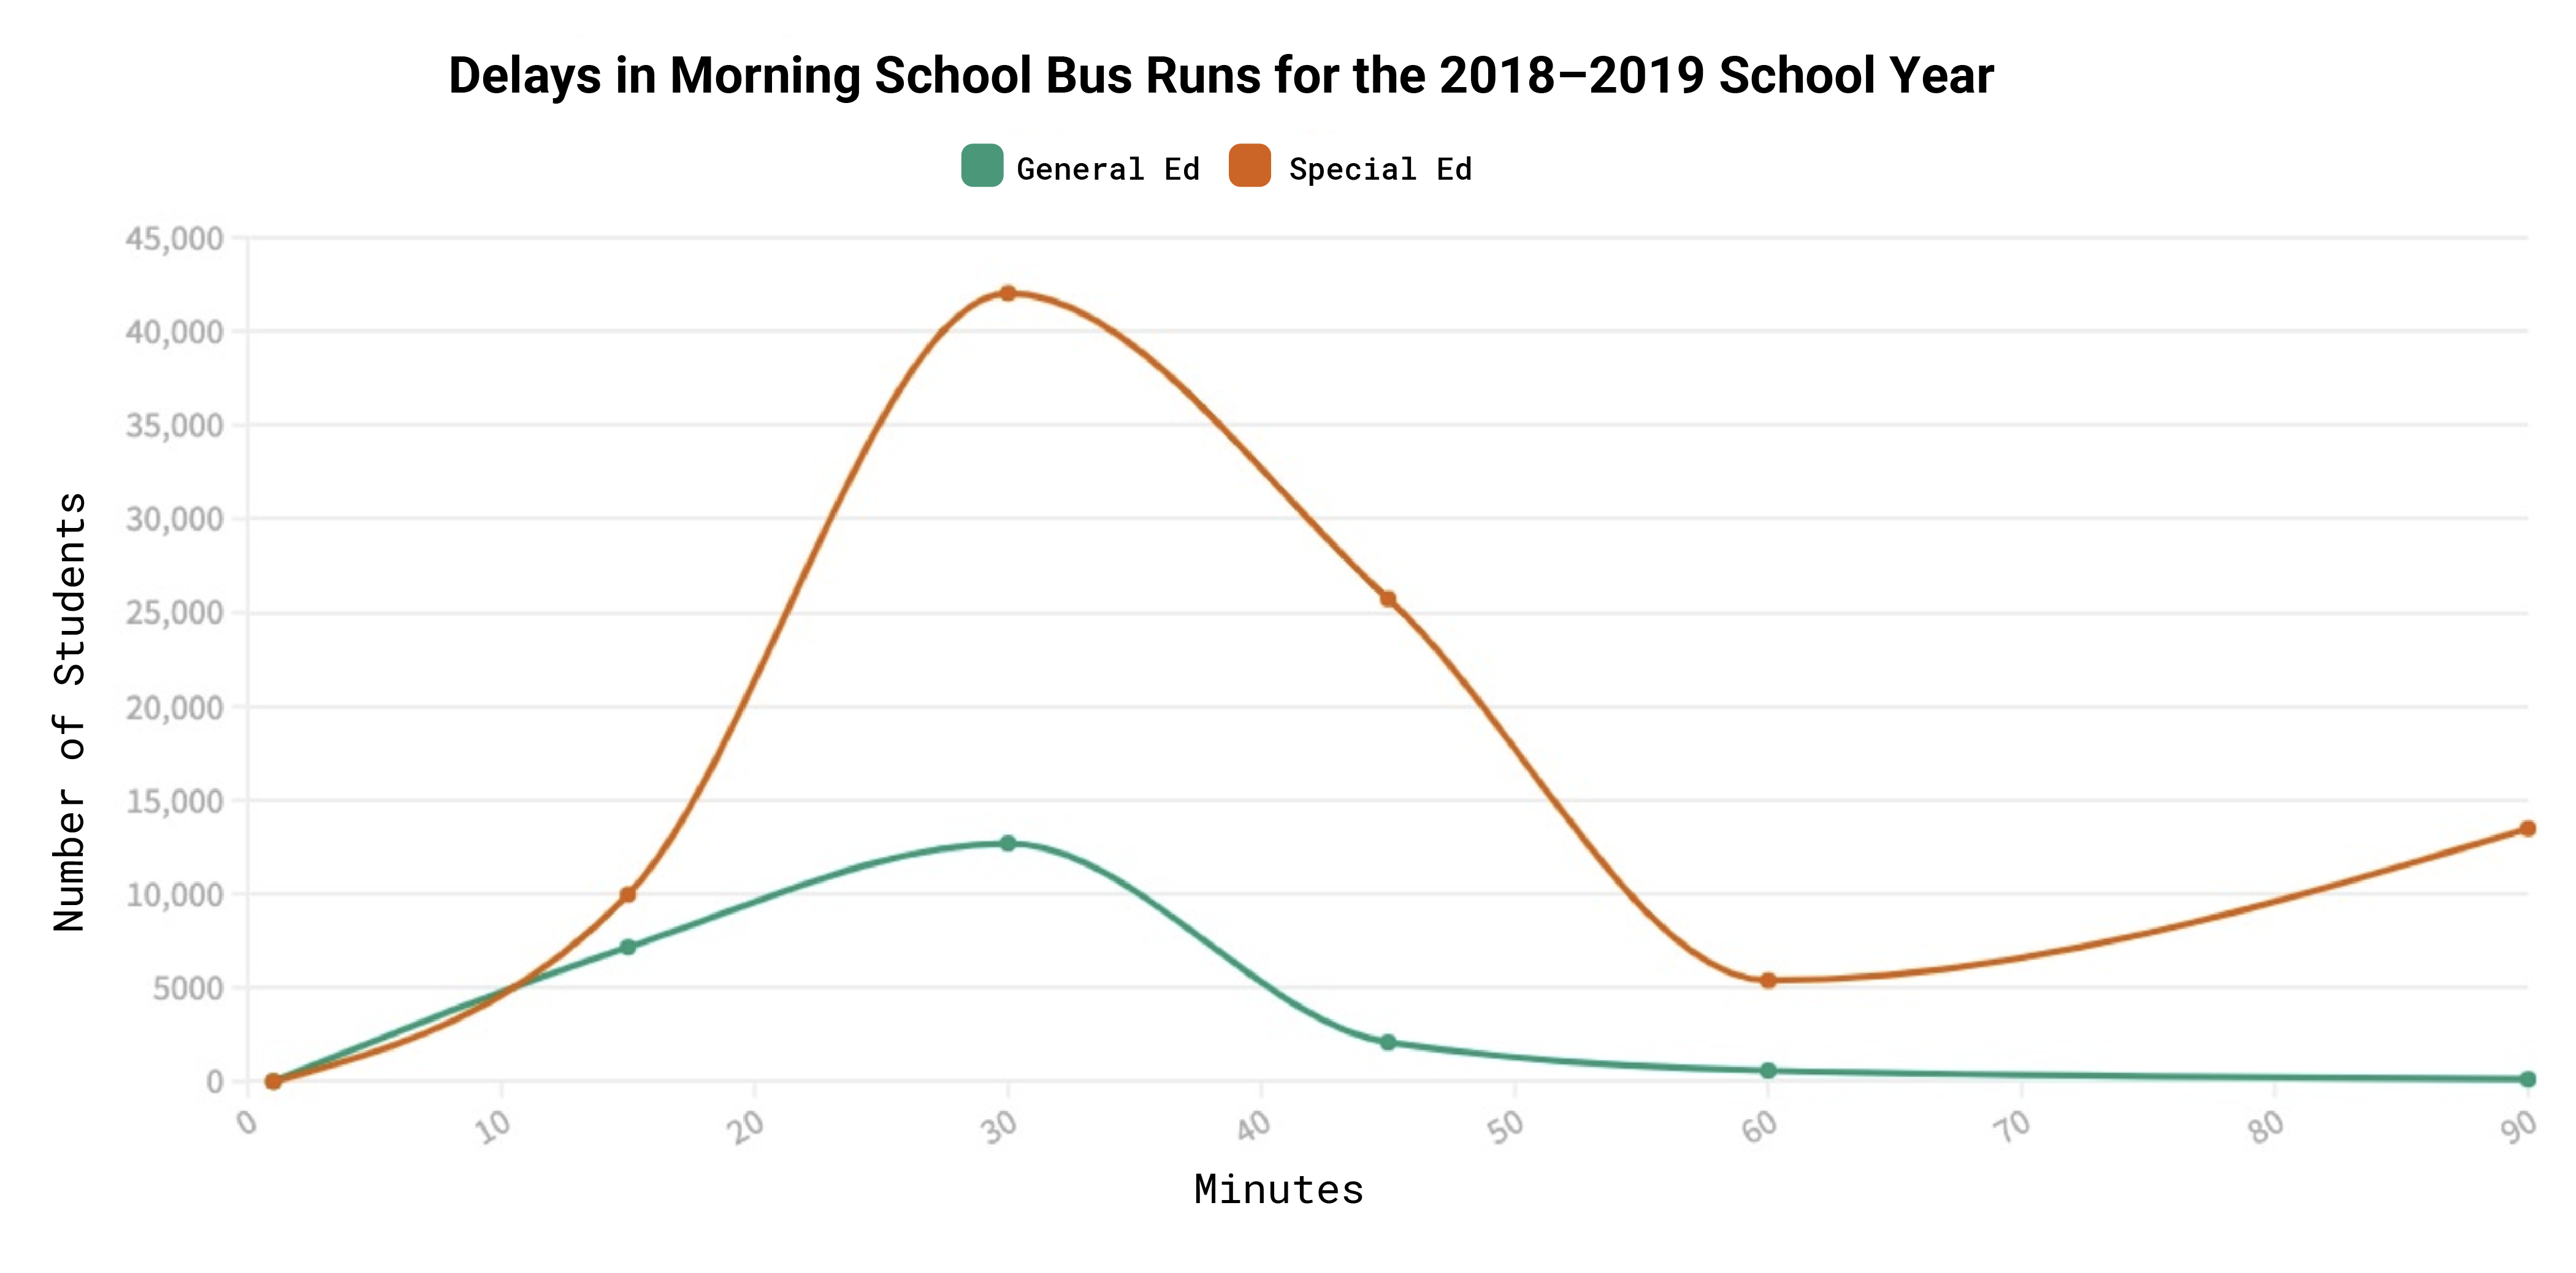
By this time, about 9,966 special education students had missed the first 15 minutes of school compared to 7,163 general education students
By now, 42,030 special education students had missed the first 30 minutes of school compared to 12,696 general education students
At the 45 minutes mark, about 25,734 special education students were late compared to 2,086 general education students
If a student is more than 45 minutes late to school in the morning, there is a chance that they will miss a whole class period. Ninety minutes late will cause a student to miss two classes. When special education students are consistently more affected by delays, this widens the quality of education they receive, reinforcing the point of the District 75 lawsuit.
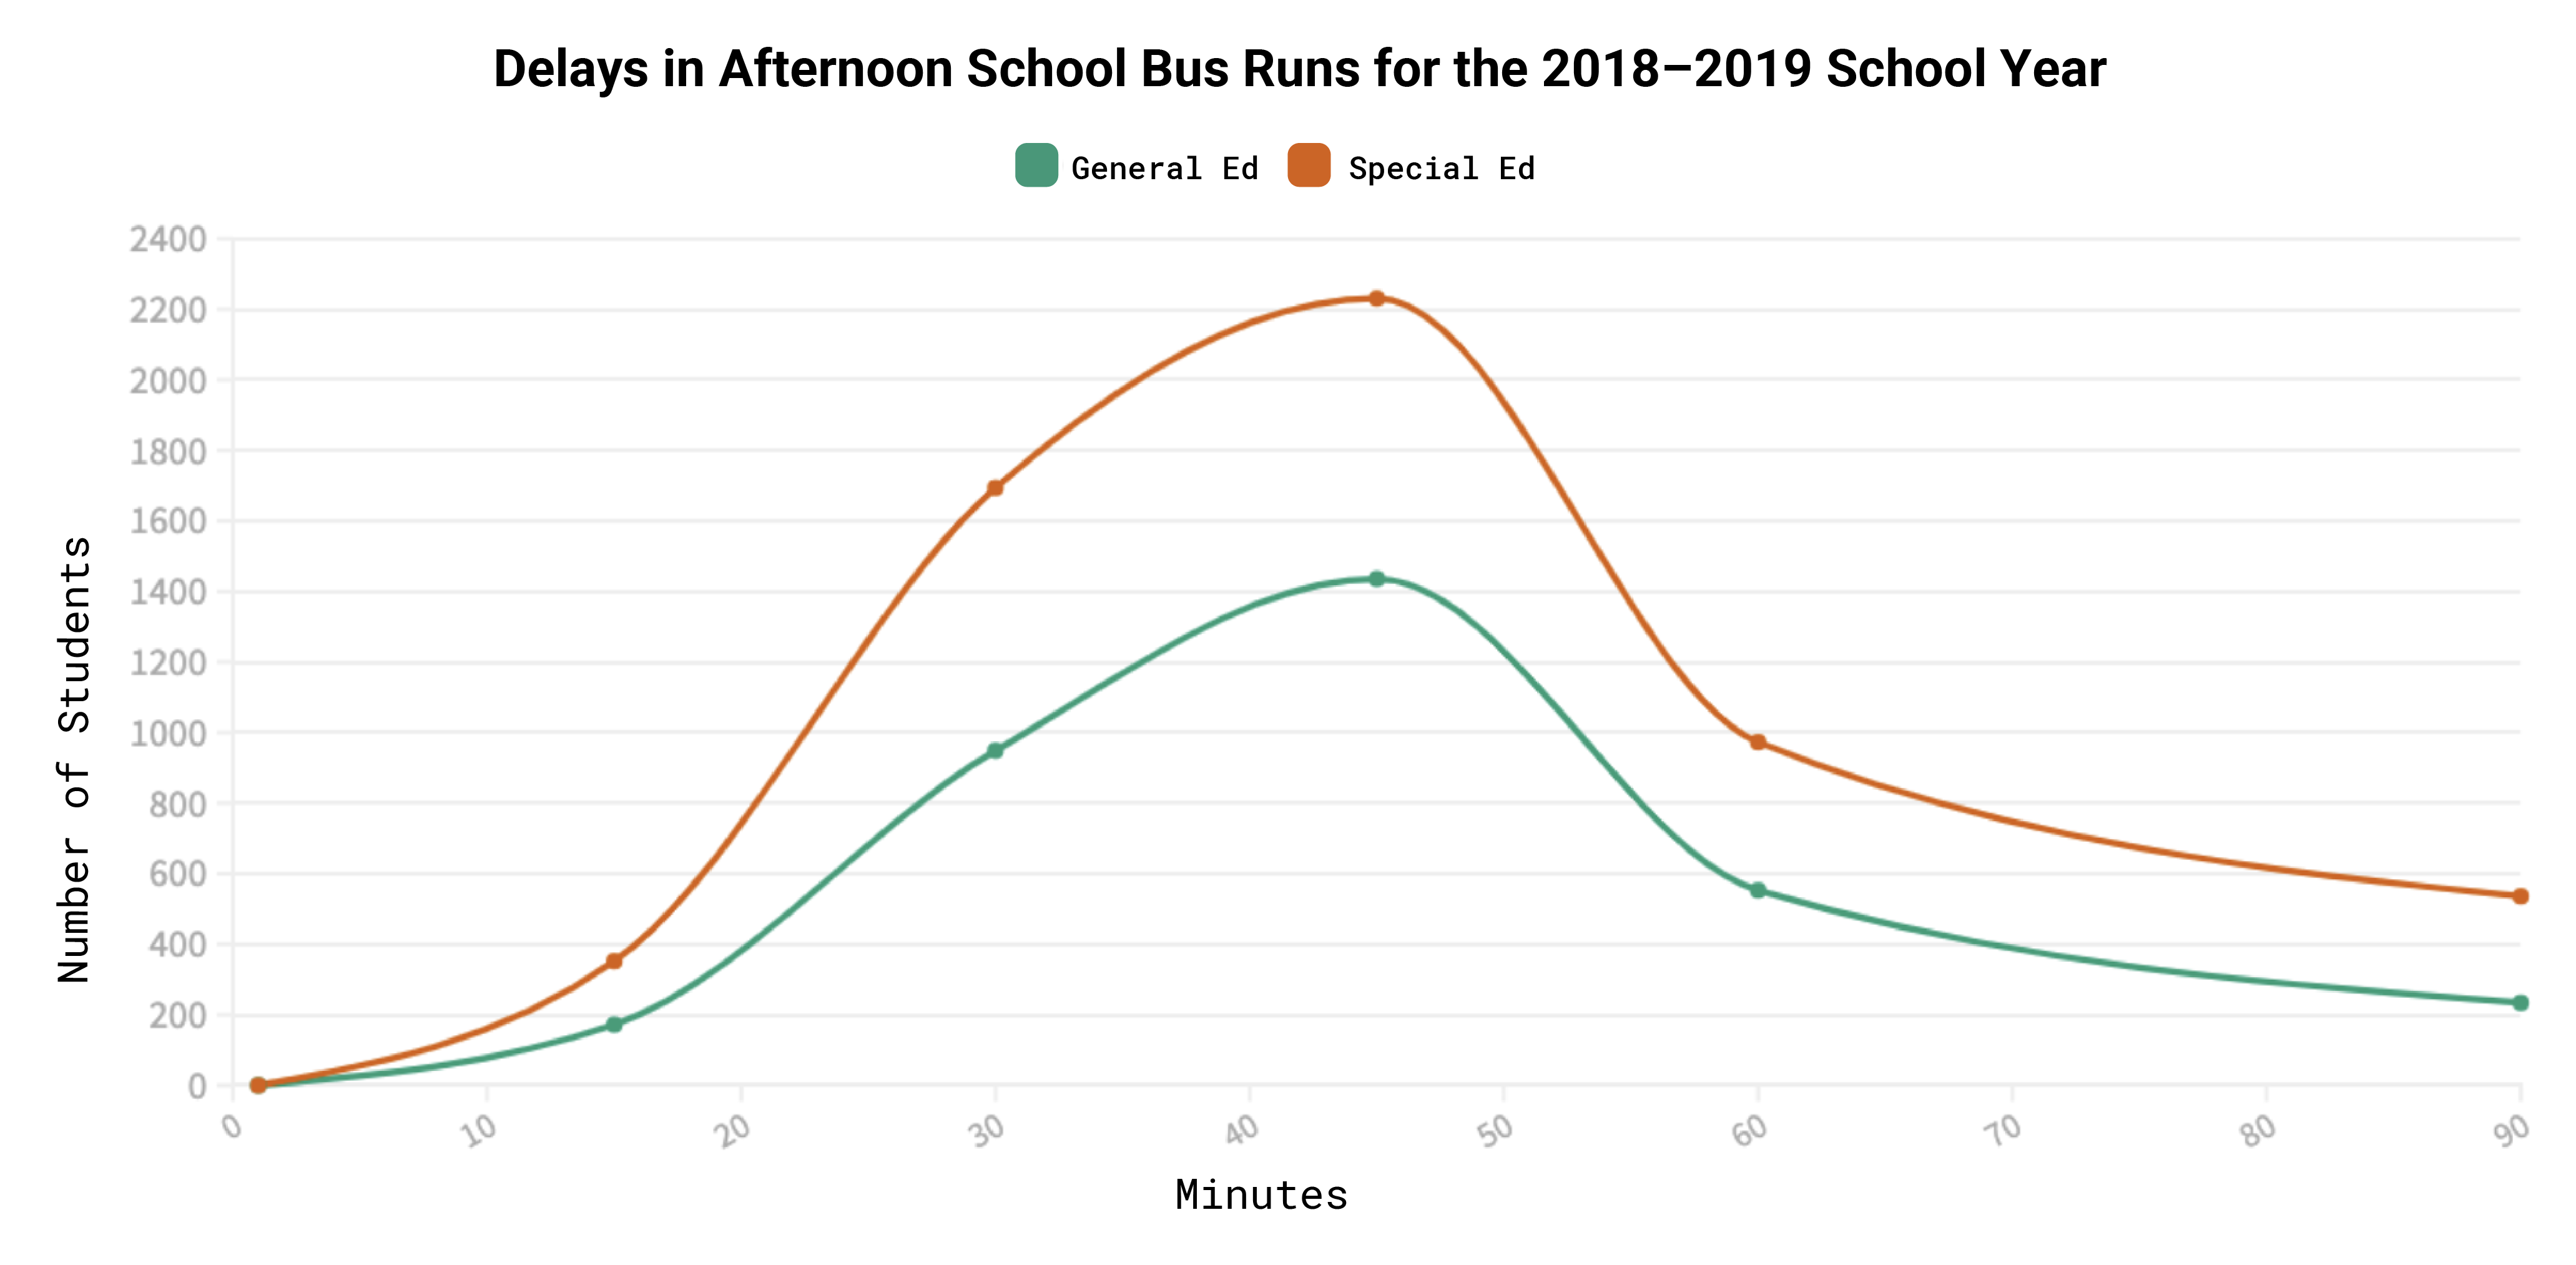
Right now, about 949 general education students were home late compared to 1,694 special education students.
About 1,436 general education students were home late compared to 2,231 special education students.
If you’re a parent of a student who’s been affected by school bus delays, there are several resources available to monitor their school day.
You can check this website for daily, real-time updates on school bus delays. If you believe you’ve been affected, you can contact the transportation liaison for your school district through the NYC DOE’s InfoHub website. You can also read a general overview of school transit here.
Here’s how we did it if you want to try it out for yourself:
This data was broken out by run type, which designated when a bus was operating during the day. To focus on students going to and from school, we focused on the AM and PM runs for general education and special education students. General education runs are a bus stop-to-school service in the morning and afternoon, and special education students have pick-up and drop-off at their doorstep.
To identify the amount of time delayed, we analyzed the time codes. We found multiple discrepancies/irregularities in the reporting for the “how_long_delayed” column. Some records were noted in minutes, some in hours, some in combinations, and others without. The OPT confirmed that the field was changed from manual entry to a pre-populated option during the 2017-2018 school year.
Any record that was not an obvious time or time range, like numbers over 400 minutes, was considered to be irregular, given that no number of students would be allowed to be stuck on a school bus for over 7 hours. The remaining records were broken into the following intervals- 1-15 minutes, 16-30 minutes, 31-45 minutes, 46-60 minutes, 61-90 minutes, and 90+ minutes.
For time records that were already in intervals that didn’t match ours, we averaged the range. For example, if a time delay were recorded as “25-40 minutes”, the average would be 32.5 minutes. Then, that number would go in the “31-45 minutes” interval.
When calculating the number of students on a bus, we omitted irregularities like student counts over four digits, like a data entry equal to 5347. We defined 80 students as the maximum number of students allowed on a large bus at one time. Any number above 80 was considered an irregularity. Considering that we were interested in analyzing the number of students delayed, we filtered out any entry with zero students on a bus.